In the Accounts field, select the account you wish to display. If you wish to add more accounts, click on + to reopen the list and add an account. You can also select a group of accounts, if you have any. To do so, select the group of your choice, which automatically includes all its accounts. You can unselect an account by clicking on it. This action doesn't remove the account from the group permanently.
In the Period field, select the type of period to display (Day, Week, Month or Quarter) then the period to display (in days, weeks, months or quarter).
In the Date type field, indicate if you wish to display your balances based on their value date or booking date.
In the Transaction status field, indicate whether you wish to take into account your confirmed and/or non confirmed forecasts. Note: If you do not check any boxes, Iziago will display the real bank balance of the selected accounts on that date.
Click on Display as tables or on Display as charts to display the results in the form of your choice.
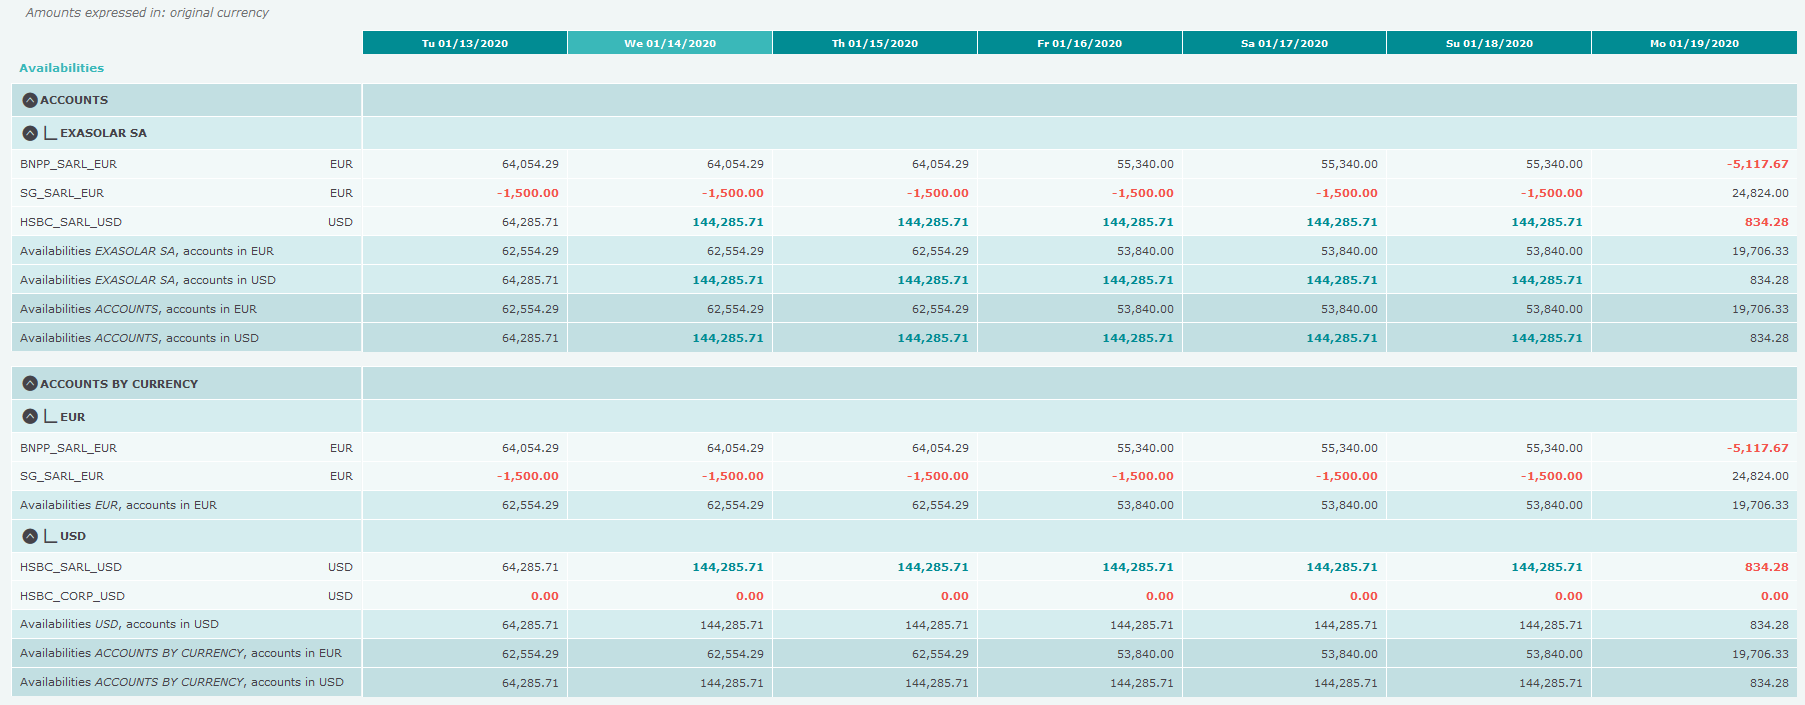
Displaying balances as tables
Click on Options to modify the display options of the tables:
Option
Definition
Details by account
Displays balances of all accounts included in the selected groups.
Reverse totals
Displays the totals first, followed by the detailed amounts per account.
Credit and debit balances separately
Displays credit and debit balances separately.
Lines with zero amount
Displays the lines containing the amounts set to zero.
Currency of amounts
Displays, in all cells, the currency in which the amount is expressed.
Amounts in
Displays the amount in the selected format:
Units
Thousands (K)
Millions (M)
You can export the table in Excel format by clicking on . The generated document respects the defined display options.
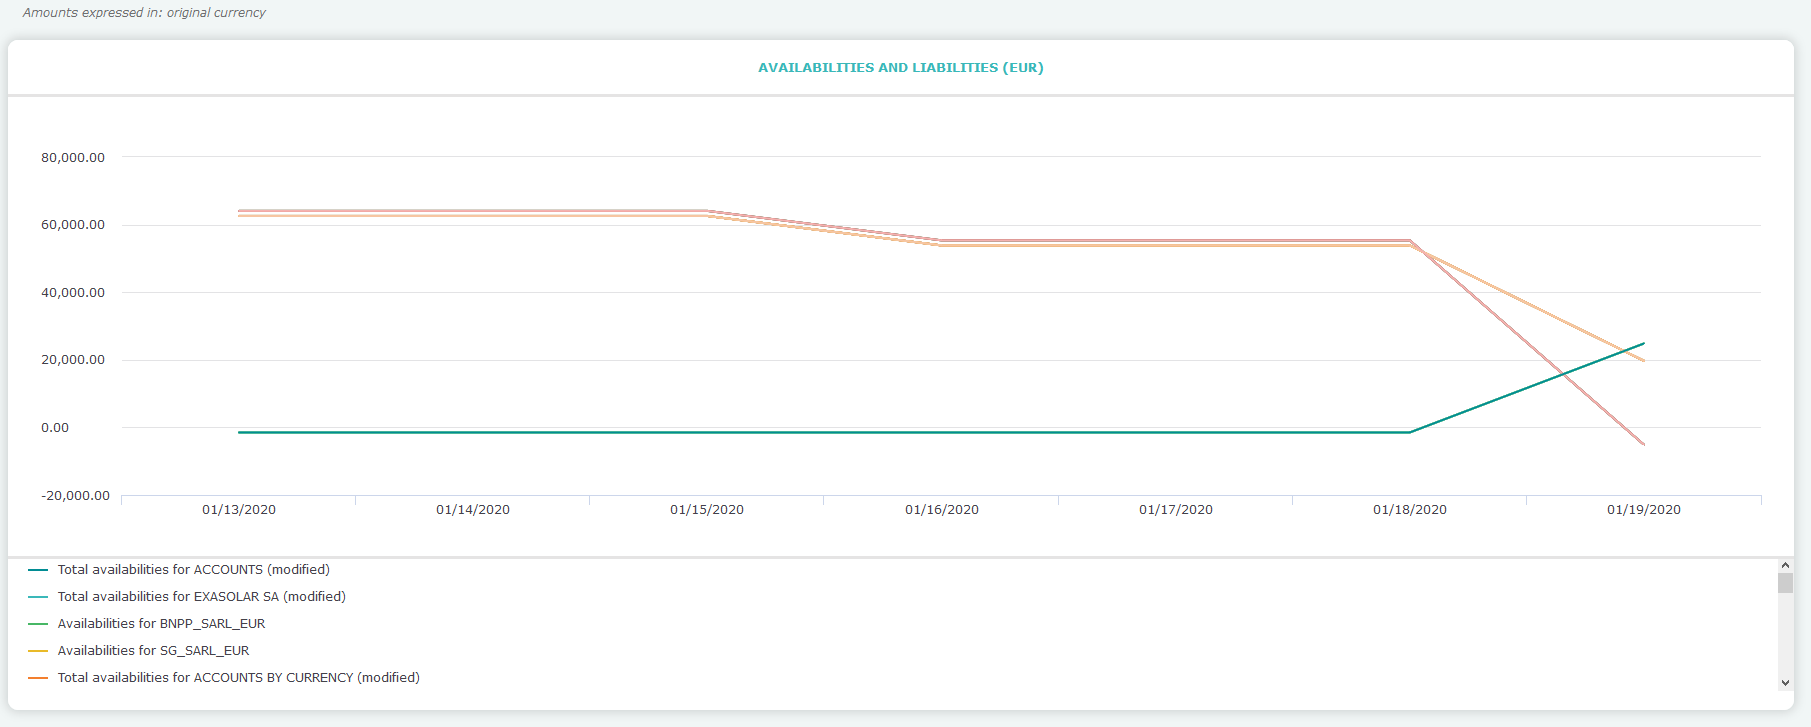
Click on Options to modify the display options of the charts:
Option
Definition
Accounts linked to a group
Displays balances of all accounts included in the selected groups..
Lines with zero amount
Displays the lines containing the amounts set to zero.
Currency of amounts
Displays, when you hover over the curve with your mouse, the currency in which the amount is expressed.
Histogram bars
Displays histogram bars in the balance chart: a red bar for the debits and a green bar for the credits. When you hover over a bar with your mouse, the number of transactions and the total balance are displayed.
Amounts in
Displays the amount in the selected format:
Units
Thousands (K)
Millions (M)
To hide the desired account balances' curve, click on the account below the chart.
To zoom in the charts, select the area to zoom in by holding your mouse pointer over it, then release it.
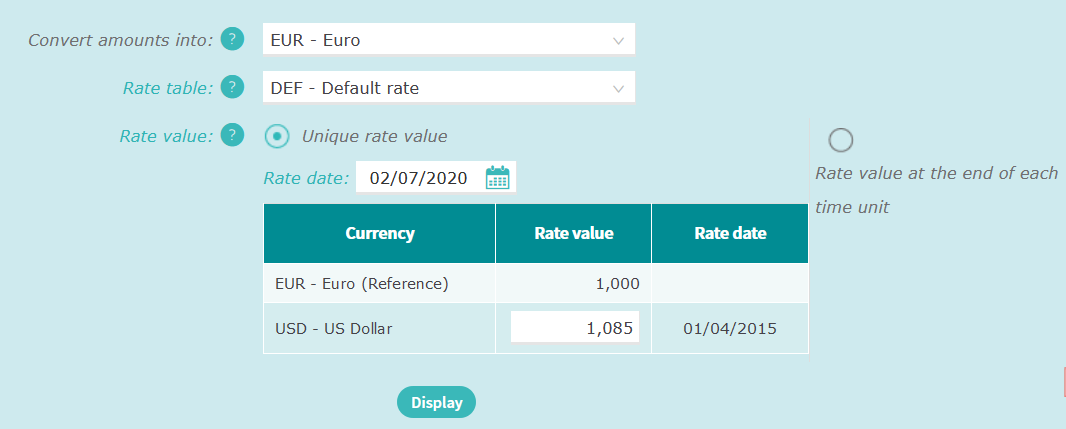
If you manage bank accounts in different currencies, you can convert the amounts into the currency of your choice. To do so:
Click on Currency conversion above the table or the chart.
In the Convert amounts into field, select the currency into which you wish to display the amounts.
Select a rate table. Note that this field is not displayed if no specific rate per company has been set.
In Rate value field:
If you tick Unique rate value, Iziago will use the same rate on the whole period you entered earlier. In Rate date, enter the current date, and in the table, leave the rate value or enter a new one in relation to the reference currency.
If you tick Rate value at the end of each time unit, Iziago will use a different rate corresponding to each unit of time you selected (day, week, month or quarter).
Click on Display. The amounts are now displayed in the selected currency.
Click to enlarge
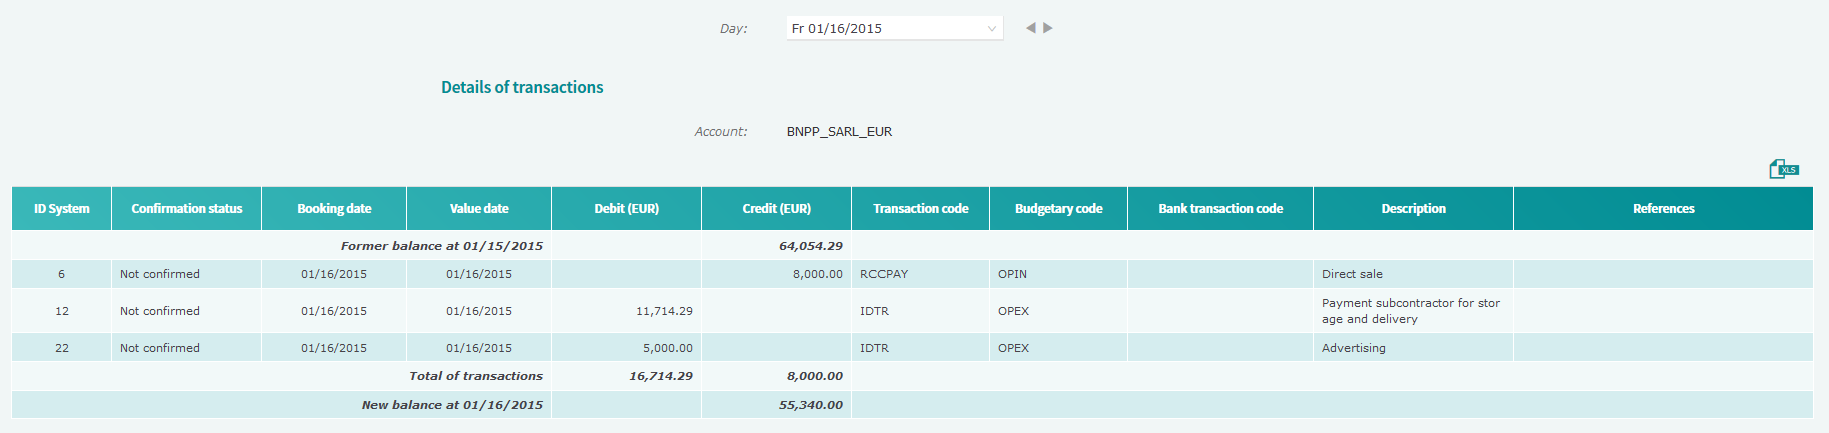
Displaying the details of the transactions
To display the details of the forecasts taken into account, click on the desired balance in the table (if the balances are displayed in table form) or click on the curve on the desired date in the graphic (if the balances are displayed in graphic form).
Click to enlarge
In the displayed screen, you can:
Add new forecasts by clicking on + New forecast.
Export the table in Excel format by clicking on .
Modify the displayed date by using the drop-down list at the top of the screen.
 Click to enlarge